The Lagom LCD monitor test pages
This page in:
English | Nederlands | 中文(简体)
The response time indicates how quickly a monitor will react to changes on the screen. This is especially relevant for fast-paced computer games.
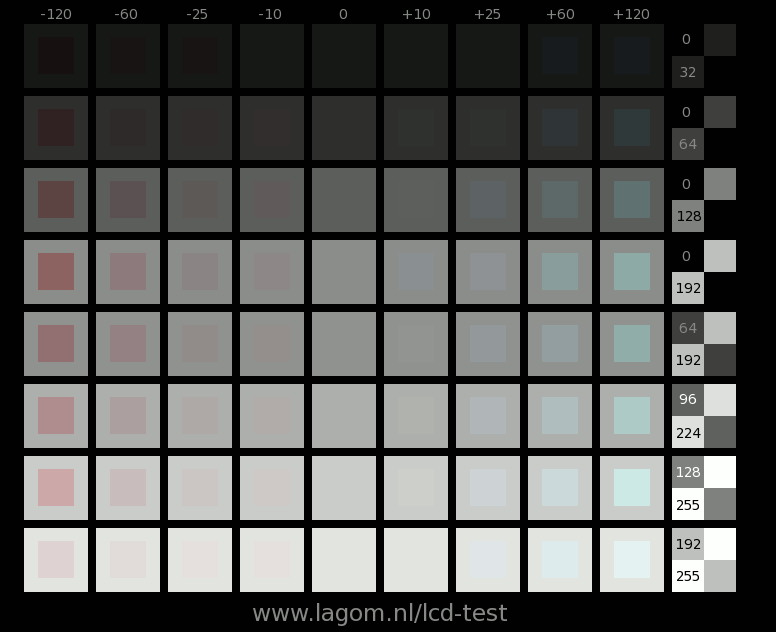
In the test patterns labeled A to H below, pixels are switched on and off at a frequency of 10 hertz. The image is designed such that the switching appears as a flashing, colored, square, especially when watched from some distance. The slower the response time of your monitor, the more pronounced the central square will appear. Ideally, you would not notice any flashing. On the right is a reference chart to help you compare the degree of flashing from one monitor to the next. For example if the flashing for one row appears pale pink, like the pink in column "-25", and another monitor has a much darker flashing, like "-120", then that is an indication that the first monitor has a considerably faster response time than the second one. The meaning of the numbers at the top is explained further down.
This test requires that the monitor is in its native resolution. If you don't see any flashing, you might need to enable animated GIFs in your web browser.
On the far right, the numbers between 0 and 255 indicate the gray levels of the transitions for each row.
Press one of the buttons below to start an animation that can show the effect of the response time on ghosting, for different gray levels. If the movement appears to be erratic or the displayed frame drop rate is nonzero, your computer may be too slow or too busy with other things. Make sure that your computer is idle.
By making photes with a short shutter time (try 1/400 second at ISO 800 or ISO 1600), you can get an idea of the dark-to-light and light-to-dark response times. The animation is at 60 frames per second, which means that each frame takes 16.67 milliseconds. For more explanation and examples, see below.
If the above test screen looks messed up, it's probably because you are using Internet Explorer.
LCD monitors do some processing on the image data before the data is sent to the display panel. This processing can take several tens of milliseconds. This can be an issue especially with computer games that require the player to react very quickly to visual input.
For this test, you need to attach a second monitor to your computer and set the video card in clone mode, such that both monitors display the same image. Take a photo of both monitors with a short shutter time (for example 1/320 s) and compare the difference in time (or the frame number). You will measure the difference in input lag; one of the monitors should have a known input lag. A CRT monitor is a good reference since it has no input lag at all.
Note: the computer should be idle, or there may be glitches (dropped frames) in the stopwatch. The accuracy is limited by the screen refresh rate, which is usually 17 milliseconds.
For more explanation, see below.
As of 2007, LCD monitors are usually advertised as having response times of 2 or 5 milliseconds. For older monitors, the response time was defined as the time needed to switch from black to white and back to black again. For newer monitors, it is the time to switch from one gray level to another gray level. The "time to switch" should be read as the time to approach the final gray level within 10% of the difference between the two gray levels. Such short response times are a bit strange, since the refresh rate is usually 60 Hz, which means that it takes 17 milliseconds anyway to update the screen. Well, rule number one when interpreting manufacturer's specifications: if they don't explain how the number is measured, then you can safely assume that they picked the method that gives the most impressive number. In this case, that could be by selecting the two gray levels where the monitor performs best.
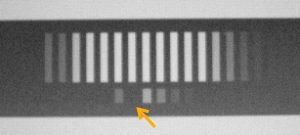
Typically, LCD monitors with twisted-nematic (TN) panels are fastest for gray-to-black transitions. However, they can be much slower for black-to-gray transitions, and that is what these tests look for. Other panel technologies, such as PVA and S-IPS, are slower than TN. PVA is especially slow with black to dark-gray transitions. The numbers that are next to the test patterns above indicate the gray levels. Black is 0, dark gray is 32–64; mid-gray is 96–192, and white is 255. Every 100 milliseconds, half the pixels switch from dark to light, while the other half switches from light to dark. If the light-to-dark transition is much faster than the dark-to-light transition, the result is that the image temporarily darkens. In the test image, only the green and blue components are switched. When they darken, the remaining red component becomes more visible, which is why the images seem to flash in red or pink. The example below shows what you might see, but without the flashing. The arrow shows which square in the reference chart resembles the striped pattern most.


What the first test (with the blinking squares) actually measures is the difference between the dark-to-light and the light-to-dark transition times. The numbers at the top represent response (difference) times in milliseconds that would give the corresponding color if the luminance of the blinking square were time-averaged.
Some monitor manufacturers cheat with the response time by designing the monitor to have a big overshoot. For example, if a black pixel (value 0) changes to a medium gray (192), rather than smoothly approaching a brightness of 192, it may first swing all the way to 255, and then slowly back to 192. If this is the case, the test pattern will appear to rapidly alternate between dark red and bright cyan. In principle it is not a good thing if your monitor does this. However, if the "red flash" is very dark, it will appear to your eye as if there is a blue flash in between.
And finally the hard physics that's behind all this. The response time is defined as the time T it takes to reach the destination luminance within 10%. However, in physics, usually relaxation times τ are expressed as the 1/e time, which means
I assume that half the pixels make a transition from luminance L1 to luminance L2 with a relaxation time τ1 and the other half of the pixels a transition the other way around with a relaxation time τ2. If such as transition happens at regular time intervals T, and assuming exponential decay curves, the average luminance is given by
The reference chart is based on this equation. At the top it shows the value
and also takes into account the nonlinear dependence of the luminance on the RGB values; the monitor should have a reasonable gamma response. Of course, if τ2 = τ1, then the images will not flicker despite a possibly long response time. However, with the gray levels where the response time matters, there is typically a big difference between the dark–light and light–dark transitions, so this test is still useful.
In the equations, I assumed exponentially decaying luminances; if the luminance behaves differently, the above equation will not be correct. On the other hand, the response time is just a number. For example, a response time of 10 ms means that a pixel needs 10 ms to do the first 90% of some transition, regardless of whether it needs another 10 or 200 ms to do the last 10%. The difference between 10 an 200 ms would be very noticeable, both in this test and in everyday use, so I believe the numbers from this test are actually better than the "true" response time.
Here are some examples, taken with a photo camera on a laptop display.
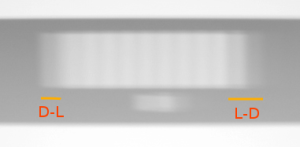
The image above shows how the animation may appear to the naked eye. It appears a bit faint at the left and right, corresponding to slow dark-to-light and light-to-dark response times. You'll get a higher accuracy with a photo camera set to a short shutter time (for example 1/400 s at ISO 800 or ISO 1600).
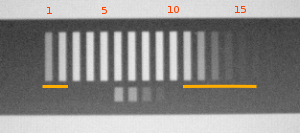
The photo above shows that the leftmost two bars are fainter than the other bars. This means that the dark-to-light response time is 2×16.67 ms = 33.3 ms. A millisecond (ms) = 0.001 seconds. The test pattern consists of 10 bars; in this image, 15 bars are visible, which means that this monitor needs 15–10 = 5 frames (83 ms) to do a light-to-dark transition. It is best to take several picture and take the average.
The above photo shows that one frame is missing. This is due to your web browser, not due to your monitor, so this image is not suitable for further analysis. This can happen even if the "dropped frame" indicator is zero; it is not possible for a web page to reliably catch every missing frame. Your computer needs to be fast enough; it appears that Firefox 2.0 needs at least a 1.3 GHz Pentium M processor.
The input lag test shows both a stopwatch in milliseconds and a frame number from 0 to 59. LCD monitors are generally updated 60 times per second, which means that the accuracy is never better than 16.67 milliseconds. Take a photo with a short shutter time of both screens to evaluate this. If necessary, try to improve the response time by clicking different gray-level buttons
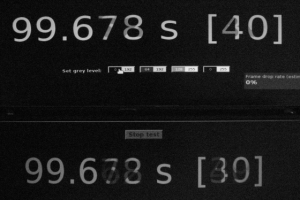
In the image above, the bottom screen has a slower response time, which makes it harder to make out the numbers. However, for both screens, the frame number is a mixture between 39 and 40. It is the highest number that counts, which means that in this case, there is no significant difference in input lag between the two screens. If the highest frame numbers were different, e.g. [39] (top) and [41] (bottom), it would mean that the top screen is the one with most input lag; more accurately: 2×16.67 = 33.3 ms.
I got the idea for this test from the vanity.dk website.
More information about how response times actually look like on typical monitors: LCD Panels with Response Time Compensation at X-bit laboratories.
© Copyright Han-Kwang Nienhuys, 2008. The text and accompanying images may not be redistributed. This includes placing the images on other websites, either as a copy or through hotlinking. Read more...